CURVE Hosts Tableau Day on Friday, September 26th
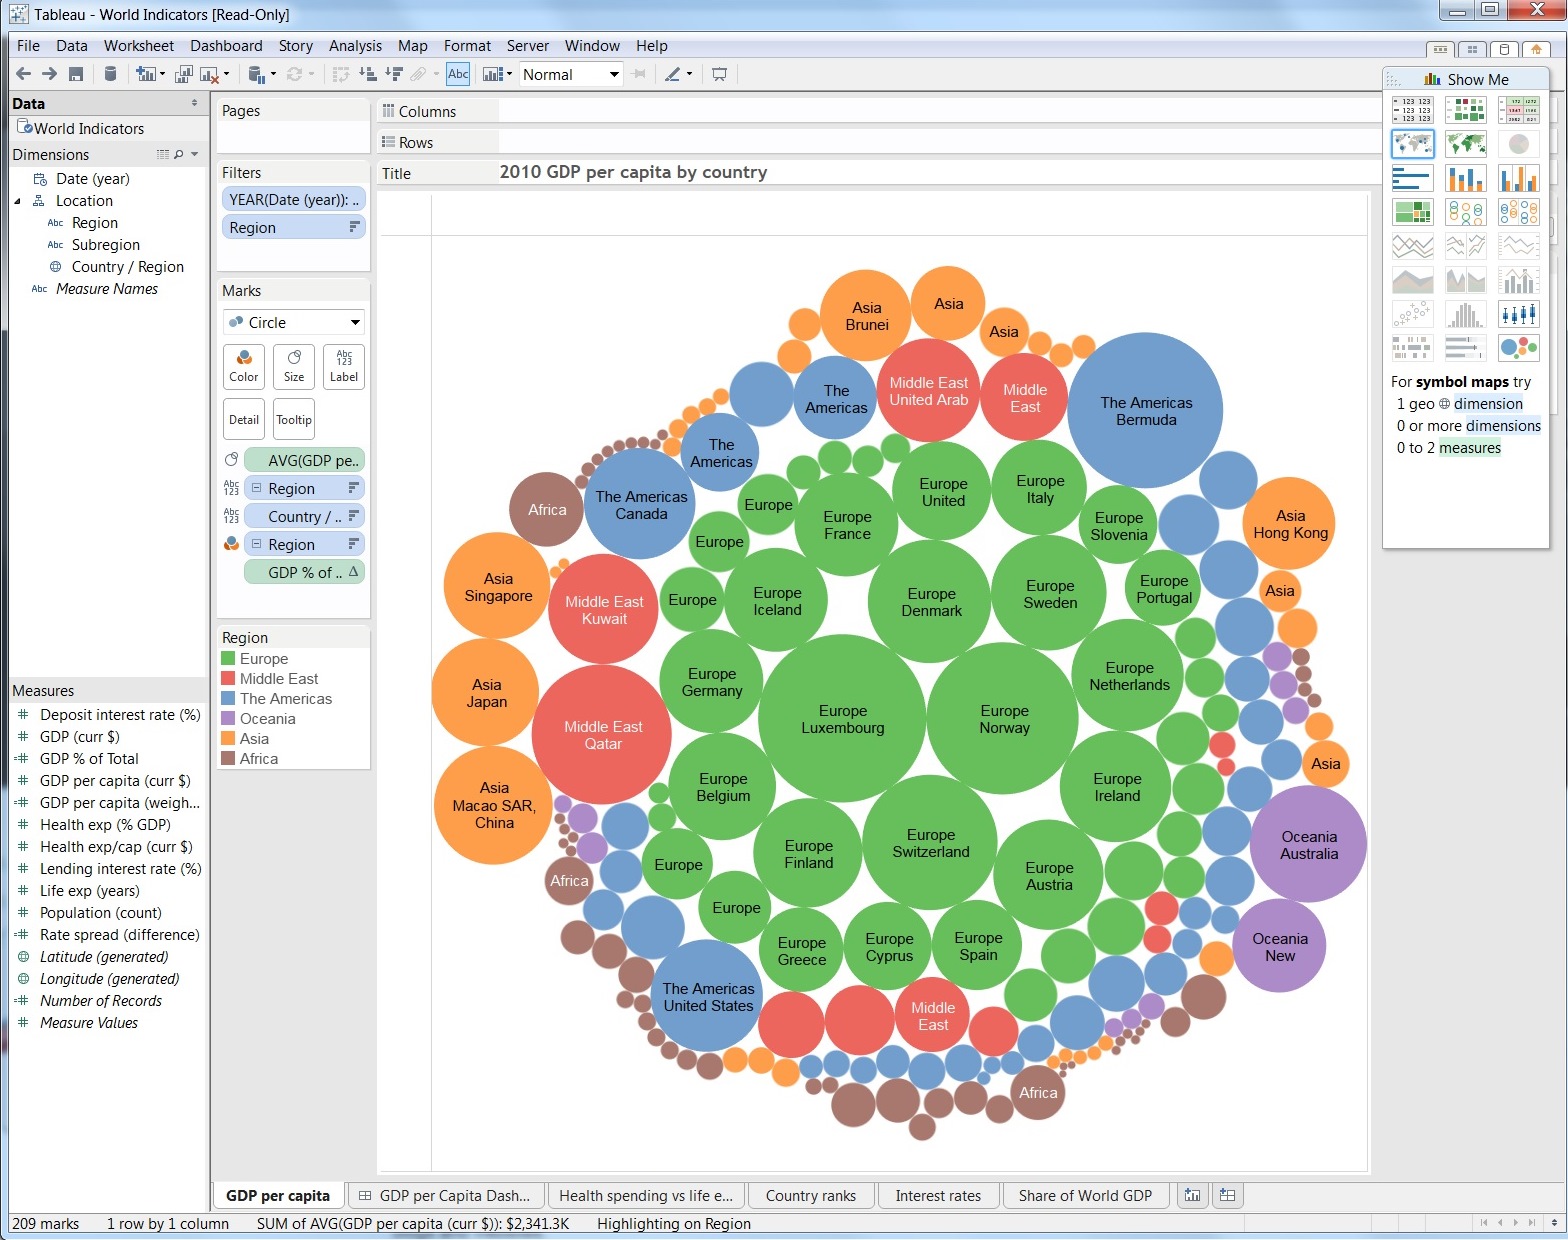
 Find out how to easily create visual dashboards that can help you find new ways to view and interpret your data, using Tableau. This hands-on event, sponsored by CURVE at the University Library, the Center for Instructional Innovation, and Decision Support Services takes place from 9:00 a.m. – 2:00 p.m. on Friday, September 26, 2014 at CURVE in Library South. The event will feature Dan Murray, InterWorks’ Director of Business Intelligence Services and author of the popular Tableau guidebook, “Tableau Your Data! – Fast and Easy Visual Analysis with Tableau Software.”
Online registration for the event is full, but we always have room for a few more, so stop by CURVE for the entire event or for just one session.
Agenda:
- 9:00am – Registration and Networking
- 9:20am – Joe Hurley, Introduce CURVE space
- 9:25am – Peter Lyons Ph.D, Associate Provost for Institutional Effectiveness presenting on “Effecting Effective Effectiveness using Data”
- 9:40am – Dan Murray, InterWorks’ Director of Business Intelligence Services and author of the widely-popular Tableau guidebook, “Tableau Your Data! – Fast and Easy Visual Analysis with Tableau Software.”
- 10:25am – Presentation by Will Kerr about on-campus Tableau training and Data Visualization user group
- 10:30am – Presentation by Jason Schumacher, Tableau’s Academic Marketing lead, on Visualization Analytics and Tableau for Teaching program
- 11:10am – Decision Support Services – Your Gateway to University Data: Presentation by Kathy Bryant-Bonds, Director of Decision Support Services at GSU
- 11:30am – Break – Lunch Provided
- 12:00pm – Presentation by Shawn Pfaff on 8 ways Universities are using Tableau
- 12:45pm – Dan Murray presents use case examples from multiple verticals
- 1:00pm – Tableau Desktop Stations
Please join us after the presentations for Q&A, individual breakout sessions, and demos.
For more information, contact Will Kerr or Joe Hurley